> ## Documentation Index
> Fetch the complete documentation index at: https://docs.flowx.ai/llms.txt
> Use this file to discover all available pages before exploring further.
# Observability with OpenTelemetry
> Monitor and analyze FlowX.AI platform performance using OpenTelemetry for distributed tracing, metrics, and logging.
## What is Observability?
Observability is the capacity to infer the internal state of a system by analyzing its external outputs. In software development, this entails understanding the internal workings of a system through its telemetry data, which comprises traces, metrics, and logs.
## What is Open Telemetry?
OpenTelemetry is an observability framework and toolkit for generating and managing telemetry data, including traces, metrics, and logs. It is vendor-agnostic and compatible with various observability backends like Jaeger and Prometheus. Unlike observability backends, OpenTelemetry focuses on the creation, collection, and export of telemetry data, leaving storage and visualization to other tools.
FlowX supports distributed tracing with OpenTelemetry.
## How it works?
The monitoring and performance analysis system uses OpenTelemetry for comprehensive tracing and logging across our microservices architecture. By integrating with Grafana and other observability tools, we achieve detailed visibility into the lifecycle of requests, the performance of individual operations, and the interactions between different components of the system.
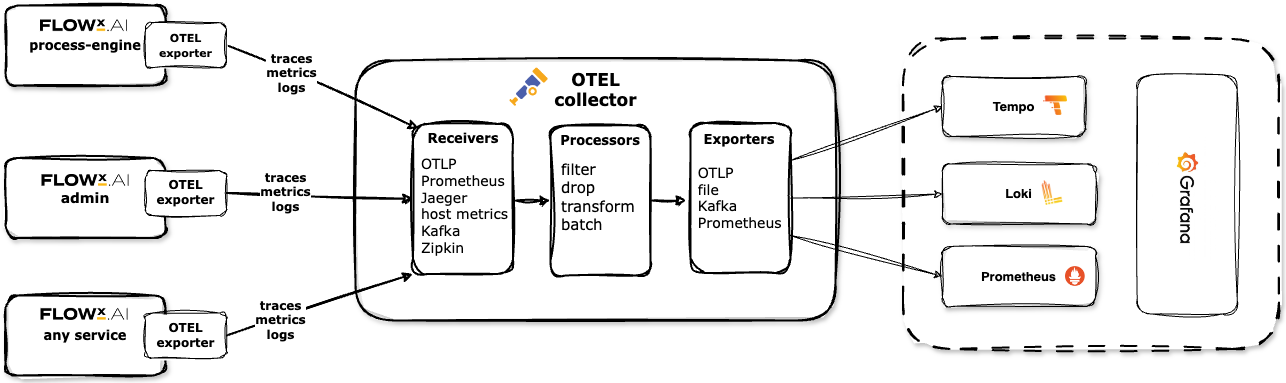
OTEL Collectors are designed in a vendor-agnostic way to receive, process and export telemetry data. For more information, see the [OTEL Collectors documentation](https://opentelemetry.io/docs/collector/).
Recommended OpenTelemetry Collector Processors: Follow the [**recommended processors**](https://github.com/open-telemetry/opentelemetry-collector/tree/main/processor#recommended-processors).
## Prerequisites
### Microservices
* **Java agent**: Configuration and deployment of the OpenTelemetry Java agent enables automatic instrumentation with no code changes required.
* **Manual instrumentation** (optional): Custom code additions for creating custom spans and enriching traces with business context. This is an advanced use case — automatic instrumentation via the Java agent is sufficient for most deployments.
* **Performance impact assessment**: Evaluate the overhead of instrumentation in your environment before enabling in production.
### Kubernetes
* Use of a Kubernetes Operator for managing instrumentation and tracing configuration.
## Instrumentation
### Auto-instrumentation with Java agent
* **Works**: Automatically wraps methods at the application edges (HTTP calls, Kafka messages, DB calls), creating spans and adding default span attributes.
* **Configuration**: Configure the Java agent for auto-instrumentation.
### Manual instrumentation
* **Custom Spans**: These were created for methods important to the business flow and enriched with technical attributes such as `fx.type`, `fx.methodName`, `fx.processInstanceUuid`, and others.
* **Custom BUSINESS Spans**: Create spans for business events.
## Business logic metadata in logs and spans
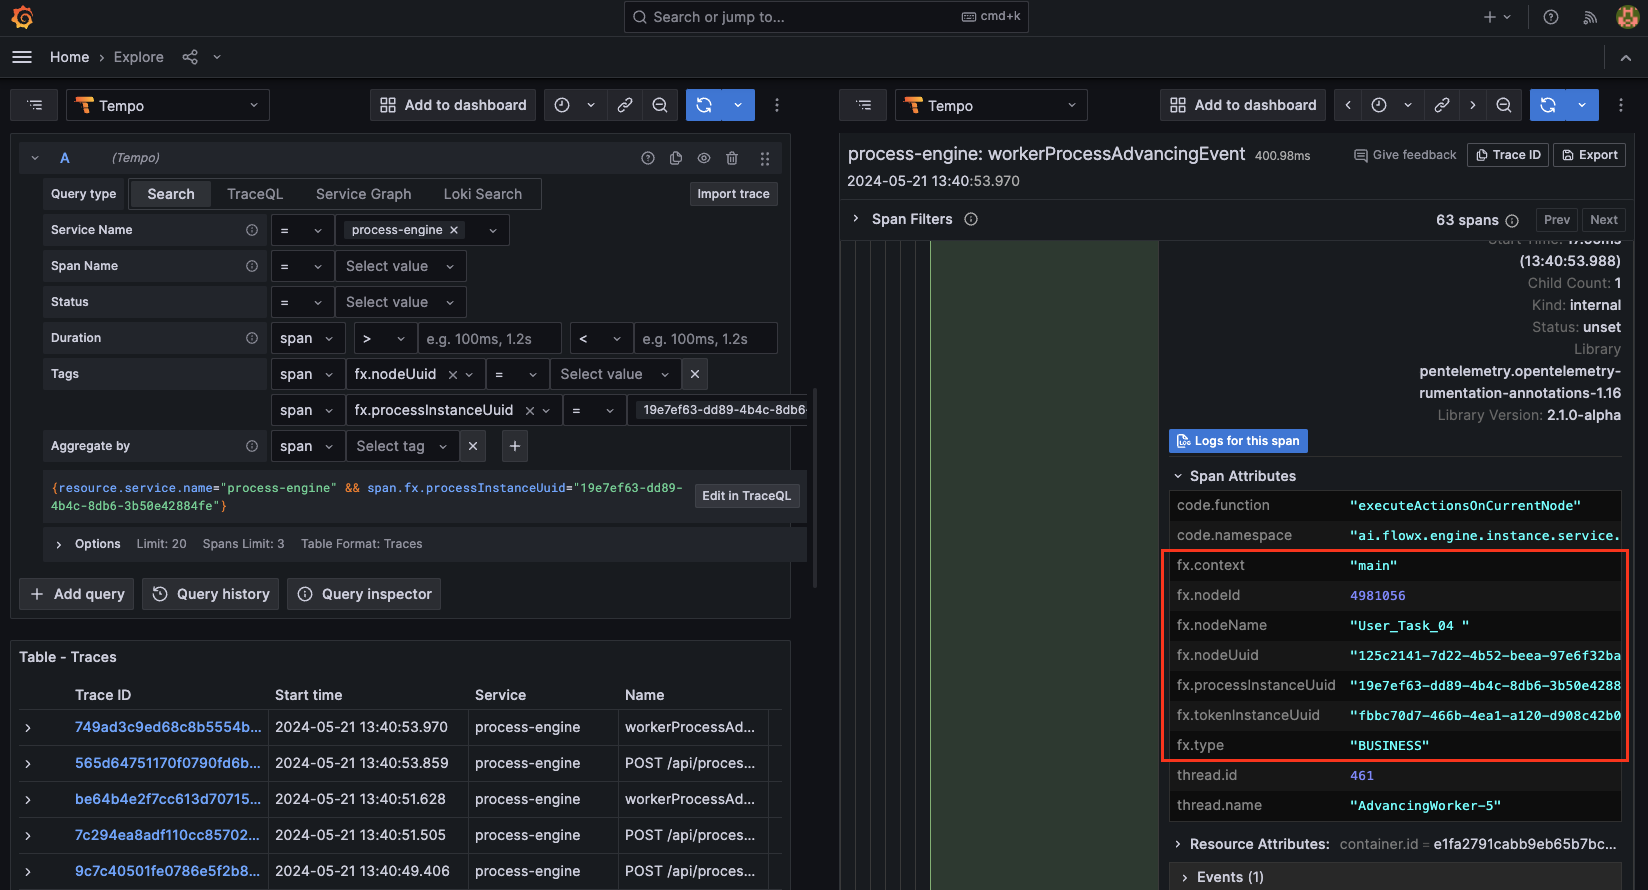
Spans now include custom FlowX attributes (e.g., node names, action names, process names, instance UUIDs), which can be used for filtering and searching in traces.
Here is the full list of included custom FlowX span attributes:
### Custom span attributes
* fx.type - BUSINESS/TECHNICAL
* fx.methodName
* fx.parentProcessInstanceId
* fx.parentProcessInstanceUuid
* fx.processInstanceUuid
* fx.processName
* fx.processVersionId
* fx.tokenInstanceUuid
* fx.nodeName
* fx.nodeId
* fx.nodeUuid
* fx.boundaryEventId
* fx.nextNodeId
* fx.triggeredByBoundaryEventId
* fx.actionUuid
* fx.actionName
* fx.context
* fx.platform
### Custom business spans
* identified by the `fx.type = BUSINESS` attribute
### Detailed trace operations
Trace specific operations and measure request time across different layers/services.
* **Process Start**: Auto-instrumentation enabled for Spring Data to show time spent in repository methods. JDBC query instrumentation can be added.
* **Token Creation and Advancing**: Custom tracing added.
* **Action Execution and Subprocess Start**: Custom tracing added.
## Controlling trace volume
By default, FlowX services sample **all** traces (`otel.traces.sampler=parentbased_always_on`). In high-throughput environments this can generate significant trace volume. You can reduce or scope trace collection at several levels **without turning off logs and metrics**, which use separate pipelines.
These controls apply to self-hosted deployments where you manage the OpenTelemetry operator and service configuration. Logs (`otel.logs.exporter`) and metrics (`otel.metrics.exporter`) are unaffected by trace sampling.
### Adjust the sampling rate (operator level)
Trace sampling is configured on the OpenTelemetry operator's `Instrumentation` resource. Lower the ratio to keep a representative sample instead of every trace:
```yaml theme={"dark"}
spec:
sampler:
type: parentbased_traceidratio
argument: "0.1" # sample ~10% of traces; "1" = all, "0" = none
```
To stop collecting traces entirely (while keeping logs and metrics), use:
```yaml theme={"dark"}
spec:
sampler:
type: parentbased_always_off
```
### Turn off tracing for a specific service
Trace instrumentation is injected per service via a pod annotation. Remove it from a service's deployment to stop tracing that service only:
```yaml theme={"dark"}
podAnnotations:
instrumentation.opentelemetry.io/inject-java: "true" # remove to disable tracing for this service
```
### Limit which libraries generate spans
Auto-instrumentation can be tuned per library through the service's OpenTelemetry properties. Turn off noisy instrumentations individually:
```properties theme={"dark"}
otel.instrumentation.jdbc.enabled=false
otel.instrumentation.hibernate.enabled=false
```
Or turn everything off by default and enable only what you need:
```properties theme={"dark"}
otel.instrumentation.common.default-enabled=false
otel.instrumentation.spring-web.enabled=true
otel.instrumentation.spring-kafka.enabled=true
```
For the full list of tunable instrumentation properties, see [Open Telemetry default properties](/5.9/setup-guides/ot-default-properties).
Some instrumentation depends on other instrumentation to work. When enabling selectively, enable the transitive dependencies too.
### Filter technical vs business spans at query time
FlowX tags every span with `fx.type` (`BUSINESS` or `TECHNICAL`). While sampling decisions are made per trace (not per span type), you can filter on `fx.type` in your observability backend. For example, query only `fx.type = BUSINESS` in Grafana/Tempo to focus on business-relevant traces without changing what's collected.
## Troubleshooting scenarios and common usages
### Scenario examples
* **Process Trace**: Analyze DB vs cache times, token advancement, node actions.
* **Parallel Gateway**: Trace split tokens.
* **DB Query Time**: Enable JDBC query tracing.
* **Endpoint Data Issues**: Check traces for Redis or DB source.
* **Token Stuck**: Filter by node name and process UUID.
* **Action Execution**: Trace action names for stuck tokens.
* **Subprocess Failures**: Analyze subprocess start and failures.
* **Latency Analysis**: Identify latencies in automatic actions.
* **Boundary Events**: Ensure Kafka schedule messages are sent and received correctly.
* **External Service Tracking**: Trace between process engine and external plugins.
### Business operation analysis
* **Long Running Operations**: Use Uptrace for identifying slow operations.
* **Failed Requests**: Filter traces by error status.
### Visualization of Traces
We recommend to use Grafana, but any observability platform compatible with OpenTelemetry standards can be used.
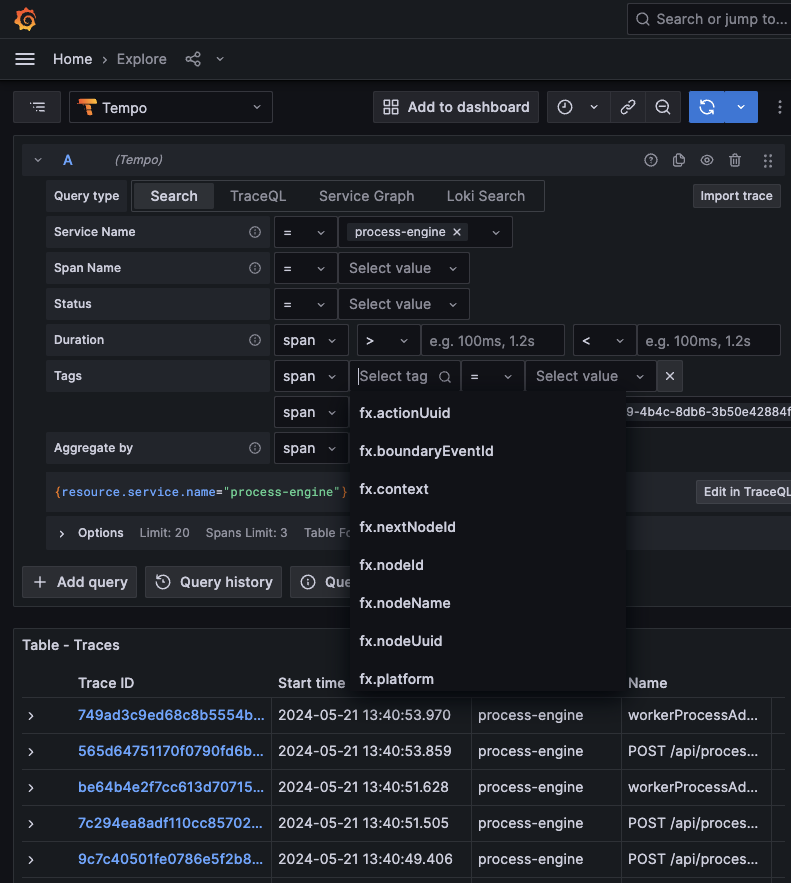
Grafana integrates with tracing backends such as Tempo (for tracing) and Loki (for logging), allowing us to visualize the entire lifecycle of a request. This includes detailed views of spans, which are the basic units of work in a trace. By using Grafana, we can:
* **View Trace Trees**: Grafana provides an intuitive UI for viewing the hierarchy and relationships between spans, making it easier to understand the flow of a request through the system.
* **Filter and Search**: Use Grafana to filter and search spans based on custom attributes like `fx.processInstanceUuid`, `fx.nodeName`, `fx.actionName`, and others. This helps in pinpointing specific operations or issues within a trace.
* **Error Analysis**: Identify spans with errors and visualize the stack trace or error message, aiding in quick troubleshooting.
Resources:
## Related topics
- [Deployment configuration for OpenTelemetry](/5.9/setup-guides/open-telemetry-config.md)
- [FlowX.AI 5.9.0 Release Notes](/release-notes/v5.x/v5.9.0-june-2026/v5.9.0-june-2026.md)
- [Open Telemetry default properties](/5.9/setup-guides/ot-default-properties.md)
- [Microservices setup guides](/5.9/setup-guides/setup-guides-overview.md)
- [AI Platform setup](/5.9/setup-guides/ai-platform-setup.md)